Modelsim Waveforms
Visualize and analyze simulation waveforms using Modelsim
Open the Modelsim project
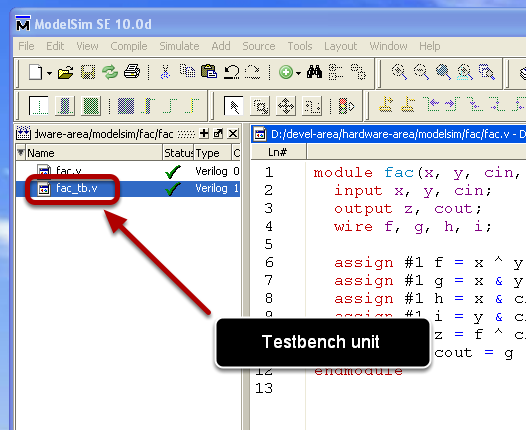
Consider the testbench unit's name to be "fac_tb" as depicted in the figure.
Start simulation
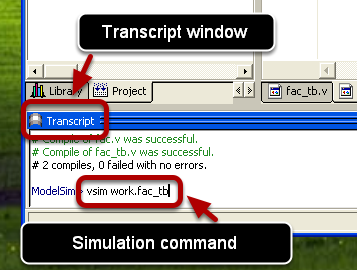
In the Transcript window execute the following command:
vsim work.fac_tb
Importnat: For different testbench modules the name of the testbench module needs to be replaced in the above command with the correct one.
Add signals to wave
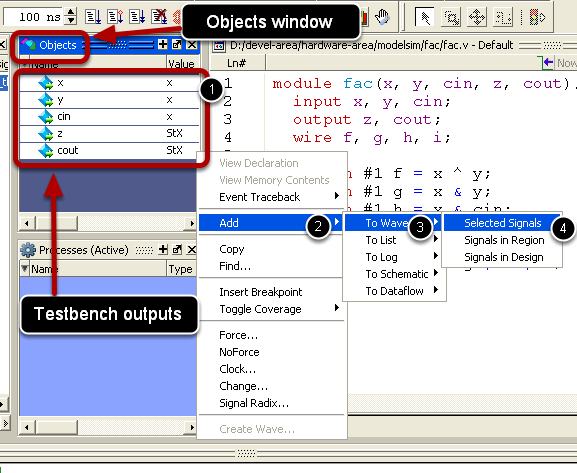
In the Objects window (if it is not displayed it can be opened from the View -> Objects menu) select all the outputs of the testbench. Add them to the wave window by right clicking on the selected signals and selecting the Add -> To Wave -> Selected Signals menu as depicted in the figure
Add signals to wave cont'ed
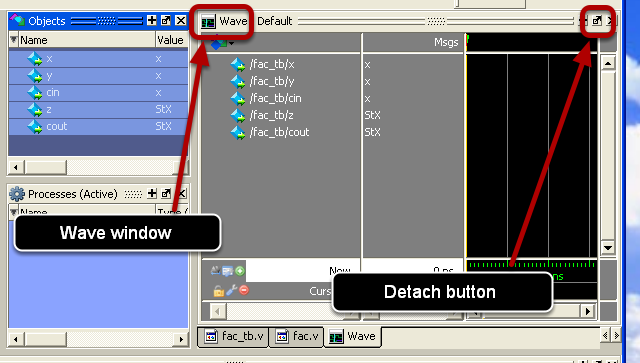
A new window will open: the Wave window which can be detached from the main Modelsim window by clicking the indicated window button.
Run the testbench
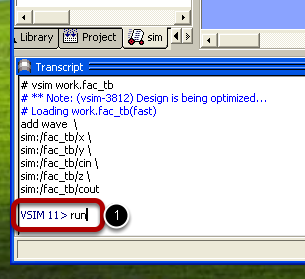
In the main Modelsim window, execute the following command in the Transcript window:
run
The effect of the simulation will become visible also in the wave window
Analyzing the waveforms
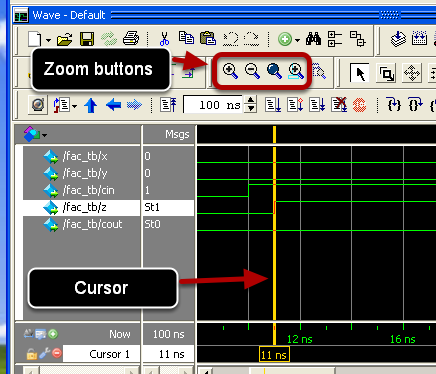
The waveforms can be zoomed using the corresponding buttons on the wave window.
The wave window makes us of a cursor (other) marked as a yellow vertical line having associated a time value (in this case 11 ns)
The module's correct behaviour can be inspected graphically: for the Full Adder Cell unit, the input signals x, y, and cin at the time 10 ns are x = 0, y = 0, cin = 1. In consequence, after a delay of 1 ns, the correct output z = 1 is obtained at time position of the cursor: 11 ns.
Close simulation
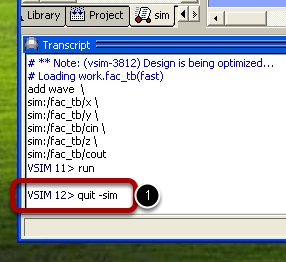
Important: Before modifying any of the source files, close the simulation!
Close simulation by executing the following command in the Modelsim's Transcript window:
quit -sim
This will close also the wave window