This project is optional.
![]()
![]()
![]() Submitting a complete and good project in time brings up to three award points ! (The project is incremental, different features bring independently points:
Cyclic dependencies -1 point, Layers - 1 point, Modularization - 1 point).
Submitting a complete and good project in time brings up to three award points ! (The project is incremental, different features bring independently points:
Cyclic dependencies -1 point, Layers - 1 point, Modularization - 1 point).
The project is individual and personal work. Plagiarism from any source is considered a serious offence. If a project presented by a student is detected as not being the result of his own work, this will lead to failing to pass the ADA exam: projects are optional, you do not have to do them - but if you do, then submit only your own work!
The project has a hard deadline. You must submit your projects using the corresponding assignments on the Virtual Campus. A submission must contain the source code and a readme file explaining your work.
Students will also do a presentation of their projects in class, with discussions and questions.
If you have questions related to this project, please address them by VirtualCampus messages or by email to ioana.sora@cs.upt.ro
A lot of information about the structure of software systems and the quality of their implementation can be obtained by examining dependencies between program elements (dependencies between classes in object oriented implementations). There are various static code analysis tools that extract dependency models from code and perform different analysis operations on them.
Your project will analyse dependencies between classes of Java systems and perform 3 kinds of analysis: Find cyclic dependencies (1 point), Find Layers (1 point), and Find Modules (1 point). In order to obtain the dependencies between classes of a Java software system, which you will use as the input for your project, use dependencyfinder.
Dependencyfinder is a complex tool suite, which contains also tools for computing various software metrics. However, for this project, you will use only the basic tool DependencyExtractor to extract dependencies in the raw format. The rest of the processing will be done by the tools implemented in your project.
DependencyExtractor takes the compiled code of the project to be analyzed (given as a *.jar file) and produces the dependencies, and it can output them in text files or xml files.
See also the depfind manual section on extracting dependencies - link.
For example, in order to obtain the dependencies of a project.jar use DependencyExtractor:
In order to obtain the dependency file in XML format, use the command:
DependencyExtractor -xml -out project.xml project.jar
In order to obtain the dependency file in textual format, use the command:
DependencyExtractor -out project.txt project.jar
Example: For example, Trio.jar contains the compiled code of a simple project with 4 classes. The generated dependencies are trio.txt and trio.xml.
You can chose which format (XML or textual) you want to use as an input for yout tool (It is not necessary that your tool supports both input formats). For parsing XML files you can use various libraries.
Your tool must be able to import dependency files produced by the DependencyExtractor (for any project size - including projects that contain hundreds of classes) and do various analysis tasks.
Some examples of inputs:
Example: For the simple project trio.jpg (dependencies in trio.txt or trio.xml), the class dependency graph is:
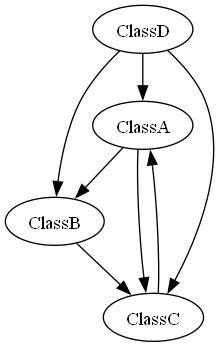
On the simple class dependency graph, your tool must analyze whether there are dangerous cyclic dependencies. It will either report that no classes are on a dangerous dependencies cycle, or print out the sets of classes involved in dangerous cyclic dependencies. However, if a cycle contains only two isolated classes it will not be reported as dangerous, considering that two classes can be tightly coupled in a bidirectional association.
For example, if the class dependency graph is depicted in the picture below, the tool should report:
There are problems with circular dependencies in following groups of classes:
- a, b, e
- c, d, h
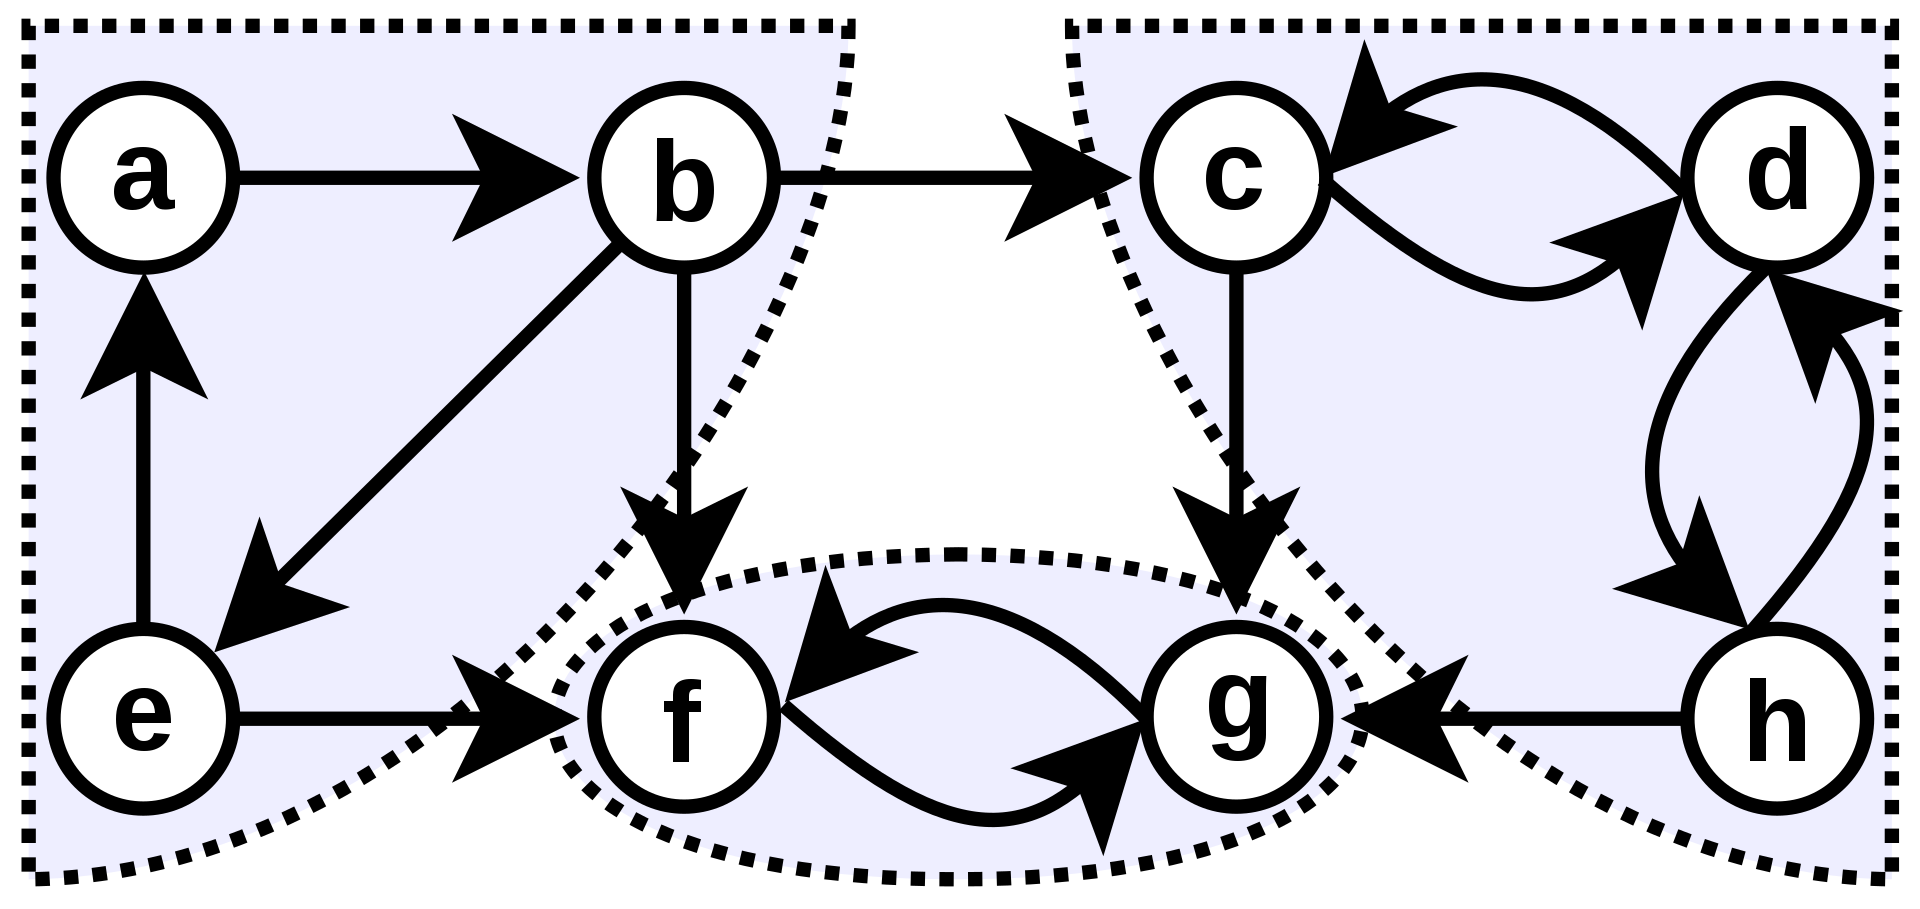
In graph terms, you have to test a directed graph for the presence of cycles and to identify the strongly connected components that contain more than 2 nodes.
Bibliography:
Your tool must arrange all the classes in a possible top-down layered order, by analyzing the directions of the class dependencies..
For the dependency graph above, the tool should report following top-down order of layers:
Layer: a, b, e
Layer: c, d, h
Layer: f, g
In graph terms, you need to know about the component graph and do a topological sorting on it.
Bibliography:
Quantifying the value of coupling between two classes X and Y is a complex problem that has to take into account the types and numbers of dependencies between the classes.
In this project, use a very simplified approach to estabish the measure of coupling between a pair of classes X and Y. Consider Coupling(X,Y)=ND(X,Y)+ND(Y,X), where ND(X,Y) represents the number of dependency situations from X to Y. In files extracted by the DependencyExtract, in order to count ND(X,Y) we count all dependencies to class Y or features (methods or fields) of class Y that come from class X or features of class X.
Build the class coupling graph as an undirected weighted graph, where the weight of an edge is given by the value of the coupling metric between the two classes.
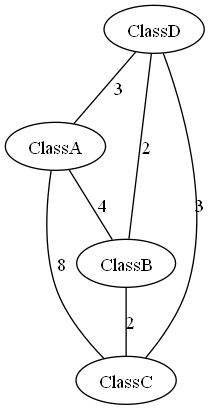
For the simple example project trio.jpg (dependencies in trio.txt or trio.xml), the class coupling graph is:
The modularization of a software system groups entities (classes) in modules(subsystems) such as to minimize the coupling between different modules. Entities that are closely connected go in the same module.
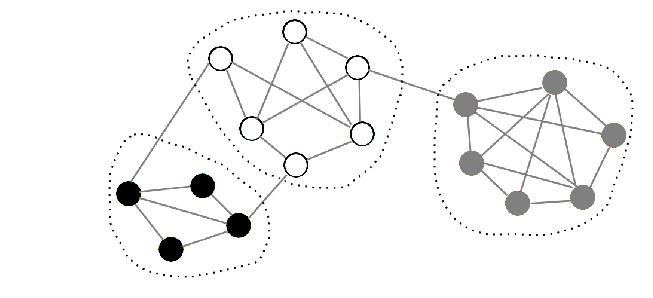
The modularization problem can be solved by graph clustering algoritms applied on the class coupling graph.
The N classes correspond to graph nodes and the "distance" between two nodes is given by the strength of the coupling between these classes. No coupling -> infinite distance, strong coupling -> small distance. The "distance" is inverse proportional with the strength of the coupling.
Our Modularization Goal: Divide the N classes up into k groups so that the minimum distance between items in different groups is maximized. This operation corresponds to the modulariztion of the systems: related classes are grouped together in modules/subsystems.
There are various graph clustering algorithms that solve the problem described above. One of the very simple such algorithms is MST-based clustering. You can apply Kruskal's algorithm to iteratively combine the clusters containing the two closest items by adding an edge between them but stop when there are k clusters. This simple MST-based clustering algorithm is a simple example of single-linkage, agglomerative clustering.
For each sysyem, let the user chose k, the desired number of clusters.
Experiment with different values for k and try to find out a rule for setting the value of k. For well established open source systems, you would expect that the componence of the clusters found by the algorithm ressembles the package structure of the system. However, in our case the coupling metric uses a simplified formula and also MST-clustering is a weak clustering algorithm, so the results will probably not meet the highest expectations.
Bibliography on MST: